

Bearish on conventional Risk Score calculators, Bullish on early interventions (part II)
Bearish on conventional Risk Score calculators, Bullish on early interventions (part II)
Exposure time to risk factors is of major importance in the assessment of total risk for major adverse cardiac events and mortality, something traditional Risk Score calculators fail to include.

In Bearish on conventional Risk Score calculators, Bullish on early interventions (part I) I wrote about why I think conventional risk score calculators, which by the way are widely recommended for practical use and decision-making, fail to accurately predict risk and are not accurate or high resolution enough to predicate decisions upon.
The main points in part I were about stuff we’re able to measure and know is contributing to MACE, but that the calculators don’t take into account. I also mentioned how the calculators take as their input data that are too low resolution, such as “diabetic: yes or no”. Questions like these are based on totally arbitrary cut-offs in reference ranges and do not yield accurate enough insight.
In this entry, I’ll discuss the cumulative effects that causal biomarkers have on risk and events, and why early intervention might be the way to go. This is something that is impossible for calculators to even include, but that might have the widest implications when it comes to prevention. Or actually, in some sense, calculators do include this, but it’s low resolution, as usual. Age, something that every calculator includes, is the strongest risk factor for almost every disease, especially cardiovascular disease. Why is that? There are certainly many answers, but one stands on top of the others. Namely, the older a person is, the more exposure they’ve accumulated to things that cause havoc. This is something the calculators try to catch by taking into account age, but due to the dynamic nature of most risk factors, it’s impossible to extrapolate risk on an individual level from population averages, and hence the calculators are not accurate enough.
I’ve discussed earlier, especially in What insight can blood work yield with regards to longevity? part I: lipids about the role that elevated lipids play in the development of atherosclerosis. If the reader were to dig into the footnotes and references they would find some discussion around the interplay between elevated blood pressure and elevated lipoproteins, something that I’ve also written about elsewhere. Borrowing a bit from my previous post:
…LDL-c lowering medications have demonstrated for every 1 mmol/l reduction in LDL-c, to reduce the relative risk of adverse events by up to 24% at one-year follow-up. Mendelian randomization studies have demonstrated for every 1 mmol/l reduction in LDL-c, in an age group of 40-80 yo, a relative risk reduction of 54%!1
In the consensus statement from the European Atherosclerosis Society Consensus Panel, randomized clinical trials done on statins were concluded to have demonstrated a consistent decrease of about 22-24% in adverse events for every 1 mM decrease in LDL-c, “independent of baseline LDL-c level, similar among persons with and without pre-existing cardiovascular disease at baseline, and remarkably consistent in all subgroups studied.” Mendelian randomization studies with longer follow-up periods have found even more impressive results, speaking for the cumulative nature of LDL-c.
It should make sense that having higher LDL-c/apoB for longer would be worse than having it for just a while. Studying these things though is not that easy. What these statin trials have shown us is that even though someone might have had elevated LDL-c for 40 years, lowering their LDL-c will lower their risk, independent of their starting level. If the effect of lowering LDL-c were not time-dependent, we’d expect the patients to reach their minimum risk at the moment their LDL-c hits the lowest point, and no further risk reduction would be observed. What we actually observe is the opposite. Even though people reach their maximal reduction quite soon after starting an intervention, the risk decreases with time, far beyond the point at which they hit their LDL-c bottom. Actually, there’s some evidence to suggest that the median reduction in LDL-c decreases with time, which should mean that events should either increase or at least stay the same with prolonged treatment.2 This is not the case though.

In the previously mentioned consensus statement, they observed a “…22% proportional reduction in the risk of major cardiovascular events per millimole per liter reduction in LDL-C over a median of 5 years of treatment. The effect was somewhat less during the first year of treatment, followed by a consistent 22-24% proportional reduction in cardiovascular events per millimole per liter reduction in LDL-c during each subsequent year of treatment”. So adverse events continued to decrease at constant rate years after the maximal reduction was accomplished, speaking to the fact that the absolute LDL-c measurement at one moment in time is much less important than knowing for how long a person has had that reading.
The consensus statement actually puts this into numbers as well. “Because the effect of LDL-C on the risk of ASCVD appears to be both causal and cumulative over time, lowering the plasma LDL-C level earlier than is currently recommended, may result in proportionally greater reductions in the lifetime risk of ASCVD than which is estimated in short-term randomized trials”:

Integrating the available evidence from Mendelian randomization studies and randomized trials suggests that each millimole per litre reduction in LDL-C reduces the relative risk of ASCVD events by ∼10% during the first year of treatment, by ∼16% after 2 years of treatment and by ∼20% after 3 years of treatment, presumably related to the stabilization of any existing underlying plaque burden. Each subsequent year of treatment after the third might then be expected to result in a further 1.5% proportional reduction in ASCVD events per millimole per litre per year…3
As I mentioned earlier, mendelian randomization with longer follow-up periods studies have found even more impressive results, speaking for the cumulative nature that LDL-c has on CVD risk. What can be observed from the table above, and more simplistically from the plot by Wang et al. below is that “5 years of treatment with a lipid-lowering agent should reduce the relative risk of ASCVD by ∼20–25% per millimole per liter reduction in LDL-C, while 40 years of treatment (or approximately equivalently 40 years of exposure to lower LDL-C) would be expected to reduce ASCVD events by ∼50–55% per millimole per liter lower LDL-C”. This suggests a huge additional risk reduction that “builds-up” when intervening earlier.

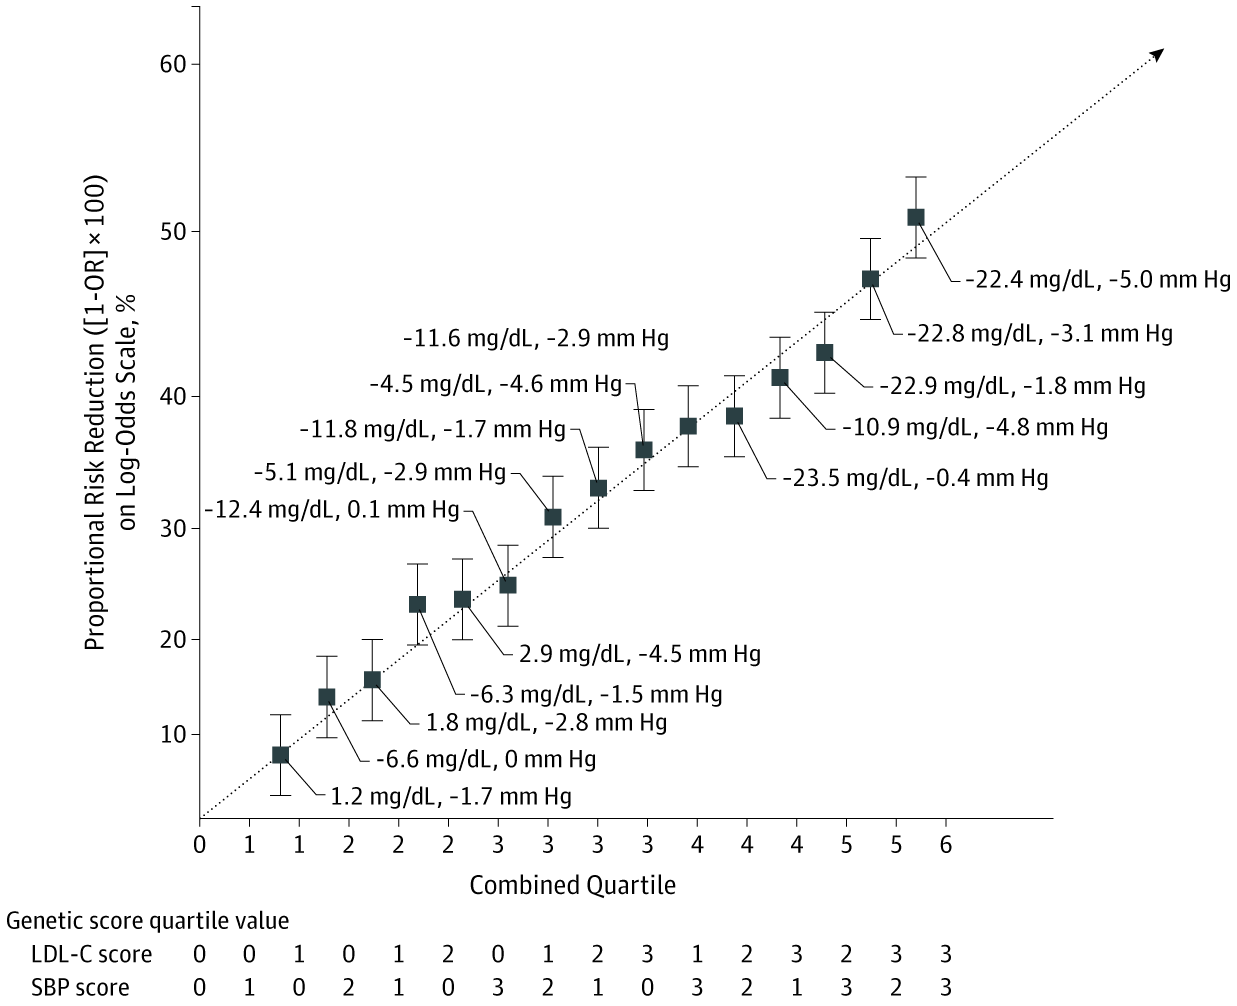
Researchers have also observed this same effect when looking at LDL-c in combination with blood pressure. Ference et al. conducted a mendelian randomization study looking at the combined effects of genetic variants associated with lower LDL-c and BP. Looking at LDL-c or BP independently, “participants with LDL-C genetic scores higher than the median had 15.1-mg/dL lower LDL-C and an OR for major coronary events of 0.74 (95% CI, 0.72-0.76; P < .001) compared with participants with LDL-C scores equal to or lower than the median. This scaled to an OR of 0.46 (95% CI, 0.43-0.48) per 38.67-mg/dL lower LDL-C values”, translating to a 54% relative risk reduction for every 1 mM decrease in LDL-c over a lifetime. Just in line with the previous conclusions. For BP, “participants with SBP genetic scores higher than the median had 2.9-mm Hg lower SBP and an OR of 0.83 for major coronary events (95% CI, 0.81-0.86; P < .001) compared with participants with SBP scores equal to or lower than the median. This scaled to an OR of 0.55 (95% CI, 0.52-0.59) per 10-mm Hg lower SBP”, translating to a 45% relative risk reduction for every 10mmHg decrease in systolic blood pressure over a lifetime.4
The figure below shows the risk reduction achieved by combined decreases in LDL-c and BP. “…combined exposure to 38.67-mg/dL lower LDL-C and 10-mm Hg lower SBP was associated with an OR of 0.22 (95% CI, 0.21-0.24) for major coronary events”, translating to a relative risk reduction of 78% over a lifetime. Because of the prevalence of CVD, the relative risk reduction carries over to enormous absolute risk reduction.
A secondary analysis of The Systolic Blood Pressure Intervention Trial (SPRINT) set out to “evaluate the long-term effects of randomization to intensive treatment with the incidence of cardiovascular and all-cause mortality approximately 4.5 years after the trial ended”. SPRINT5 in and of itself found, after being stopped early due to the magnitude of the effects, that the cohort treated “intensively” to a target of 120 mmHg SBP had better outcomes than the cohort treated to a target of 140 mmHg SBP:
At 1 year, the mean systolic blood pressure was 121.4 mm Hg in the intensive-treatment group and 136.2 mm Hg in the standard-treatment group. The intervention was stopped early after a median follow-up of 3.26 years owing to a significantly lower rate of the primary composite outcome in the intensive-treatment group than in the standard-treatment group (1.65% per year vs. 2.19% per year; hazard ratio with intensive treatment, 0.75; 95% confidence interval [CI], 0.64 to 0.89; P<0.001). All-cause mortality was also significantly lower in the intensive-treatment group (hazard ratio, 0.73; 95% CI, 0.60 to 0.90; P=0.003).
SPRINT was stopped early after only 3 and a quarter years. The delta of the median SBP between the groups was 14.8 mmHg and this resulted in 25% fewer adverse events during the intervention. From the previously mentioned MR studies, we concluded a 45% relative risk reduction for every 10mmHg decrease in systolic blood pressure over a lifetime. The discordance between the results in SPRINT and the MR studies is explainable by the difference in exposure time to high blood pressure. We’ve concluded elsewhere that the reduction in risk that comes from lowering blood pressure extends to at least 115 mmHg SBP, giving rise to the SPRINTs treatment design of 120 mmHg vs. 140 mmHg as a target level. SPRINT also shows that 120 mmHg is better than 140 mmHg, but doesn’t show that this effect is lasting if the treatment is interrupted. What the MR studies indicate, and SPRINT not is that lower for longer is better and that the risk continues to decrease past 3.25 years, if the desirable SBP levels are maintained. Hence the motivation for the secondary analyses.
…at the median total follow-up of 8.8 (8.3-9.3) years, there was no longer evidence of benefit for cardiovascular mortality (HR, 1.02; 95% CI, 0.84-1.24) or all-cause mortality (HR, 1.08; 95% CI, 0.94-1.23). In a subgroup of participants, the estimated mean outpatient SBP among participants randomized to intensive treatment increased from 132.8 mm Hg (95% CI, 132.0-133.7) at 5 years to 140.4 mm Hg (95% CI, 137.8-143.0) at 10 years following randomization.
What caught my eye was that “SBP among participants randomized to intensive treatment increased from 132.8 mm Hg at 5 years to 140.4 mm Hg at 10 years”. When the treatment was stopped early at 3.25 years, the median SBP was 121.4 mmHg. Only 1.5 years after that SBP has risen by 11.4 mmHg, and after 6.5 years by 19 mmHg compared to treatment levels. The secondary analysis shows that this rise demolishes the benefit achieved during the treatment:
The HR for CVD mortality among participants randomized to intensive vs standard treatment was 0.66 (95% CI, 0.49-0.89) during the trial phase and 1.02 (95% CI, 0.84-1.24) during the observational phase. The time-dependent effect of intensive vs standard treatment indicated a benefit for CVD mortality from 2.3 to 5.6 years from randomization and was attenuated throughout the remainder of the observational phase

The conclusion might not be immediately obvious here, but with the support of another secondary analysis, here’s how I look at this: at already 3.25 years (actually 2.3 years, see figure above) of intervention we see meaningful decreases in events due to the achieved reduction in systolic blood pressure. If the intervention is stopped and the SBP reverts to baseline, the meaningful risk reduction disappears quite fast. It’s important to remember that these results are in contrast to a treatment group with a target SBP of 140 mmHg. We’re not comparing to wildly hypertensive patients. So let’s run a thought experiment. A 55 yo patient with SBP of 145-155 mmHg comes to consult me on their BP. We know that their BP has been creeping up over the last 20 years or so. The conventional view is that if they have an SBP < 160 mmHg, we should not treat them pharmacologically. So let’s say that we try lifestyle interventions: we increase their exercise, decrease their sodium and refined carbohydrates intake, increase their potassium and magnesium intake, check their uric acid, make them drink more water and stress less, and so on. Our patient is diligent and compliant and does everything we ask them to, but hammering in all these habits takes about 3 to 4 years or so. After 4 years or so the patient’s SBP is around 135-140 consistently. Is this a good enough success? We’ve done everything according to guidelines: 135 < SBP < 160 → lifestyle intervention, target SBP 135 → achieved. Are we all good?
I’d argue no, not good enough. First of all, SPRINT certainly shows us that 120 mmHg is more desirable than 140 mmHg. Secondly, we’ve just spent ~4 years of our patient’s life trying to bring down their BP, with some success. But SPRINT demonstrated had we done it immediately, we would have reduced their risk more than we’ve done til now. Of course, we might see benefits in other areas such as glucose and whatever, but that doesn’t mitigate the havoc high BP does. Vaduganathan et al. show in a secondary analysis of SPRINT that: “At age 50 years, the estimated residual survival was 37.3 years with intensive treatment and 34.4 years with standard treatment and at age 65 years, residual survival was 24.5 years with intensive treatment and 23.3 years with standard treatment (edited)”.6 Lowering BP from 140 mmHg to 120 mmHg when one is 50 and 65 yo will yield on average 3 and 1.1 extra years of life, respectively. The absolute numbers might not seem that impressive, but when a person is on their deathbed, they certainly are. What can explain the difference in absolute life extension between the age groups? It's the comparatively less time the 50 yo has been exposed to high blood pressure. The 15 years of time, from 50 to 65, exposed to 140 mmHg vs. 120 mmHg will contribute to shortened lifespan and increased events in later days.

Lastly, I want to tie this all together to the risk score calculators. As I discussed in part 1, Risk Score calculators are meant to be tools for assessing the probability of MACE within a given time period, 10 years for example. The calculators are mainly used to make decisions about which route of intervention is warranted. Without getting into the critiques of part 1, we can now, based on the conclusions from this post, start to understand why the input of single point-in-time measurements can create misled conclusions and not contribute accurately enough to the determination of risk.7 The duration for which a person has been exposed to any significant risk factor makes a difference, and the earlier we can intervene, the more confident we can be in our course of action. Unfortunately, calculators leave a lot of meaningful information out and incentivize outsourced decision-making, which is not only dumbing down but depriving the practitioner of independent thinking and responsible decision-making.
